Dashboard Tab
The Dashboard tab displays the following metrics:
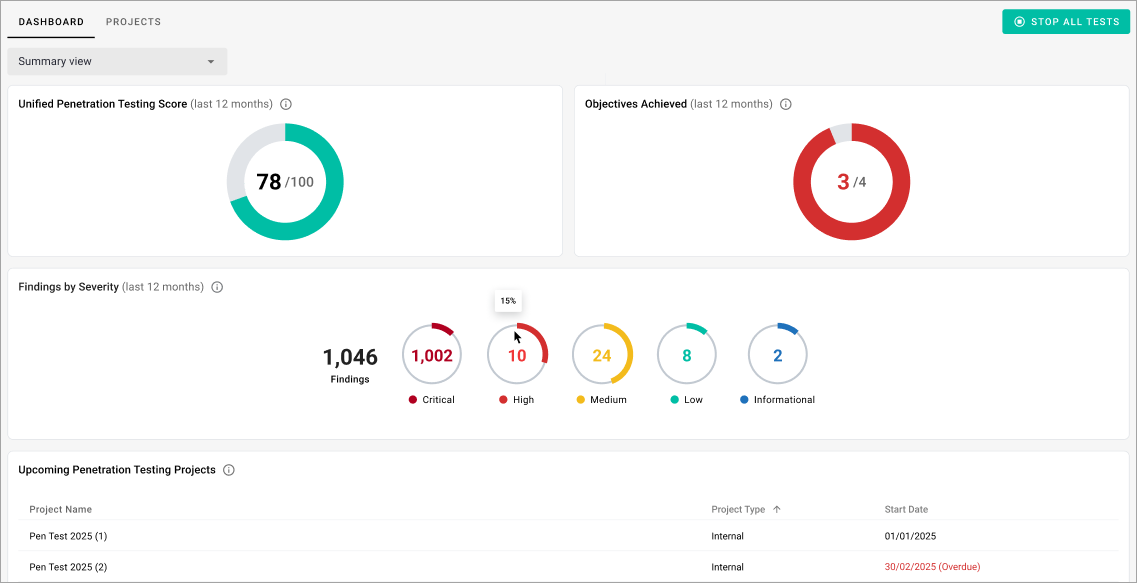
- Unified Penetration Testing Score (last 12 months)—shows your organization's overall security posture based on the results of your penetration tests. This proprietary scoring model was developed by FORTIFIED to provide a consistent, objective view of your security performance over time.
- Note: Click the chart to navigate to the Client Pentest Project list, filtered by all completed projects within 12 months.
- Objectives Achieved—tracks the number of achieved testing objectives.
- Note: Click the chart to navigate to the Client Pentest Project list, filtered by all completed projects within 12 months.
- Findings by Severity—shows the total number of findings from penetration tests, categorized by severity: Critical, High, Medium, Low, and Informational.
- Upcoming Penetration Testing Projects—shows all scheduled penetration testing projects grouped into a table with Project Name, Project Type, and Start Date columns. Overdue projects are flagged in red for visibility.
- Note: Use the dropdown at the top of the page to switch views. By default, the Summary View shows aggregated data. You can also select a completed project to view it separately.
Related Topics