Dashboard Tab
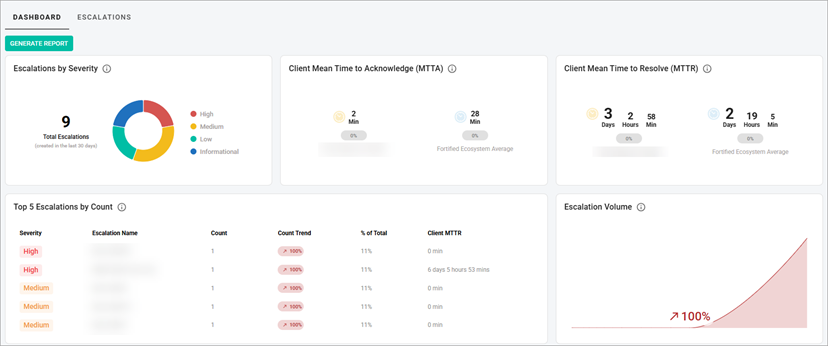
The Dashboard tab displays the following metrics:

- Escalations by Severity—shows a breakdown by severity of the escalations received in the last 30 days.
- Client Mean Time to Acknowledge (MTTA)—shows your average mean time to acknowledge (MTTA) escalations for the last 30 days, along with a 90-day trend of that datapoint, compared to the average of the same data across the Fortified Ecosystem.
- Client Mean Time to Resolve (MTTR)—shows your average mean time to resolve (MTTR) escalations for the last 30 days, along with a 90-day trend of that datapoint, compared to the average of the same data across the Fortified Ecosystem.
- Top 5 Escalations by Count—shows the top five escalations by count for the past 30 days, along with a month-over-month trend for each escalation type, the percentage each type represents of your total escalations, and the average MTTR for each.
- Escalation Volume—shows the percentage increase or decrease in escalation volume from 90 days ago to the present, along with a 90-day trend for that data point.
- Note: To get the data from the ASM dashboard in .pdf format, in the upper-left corner of the page, select the Generate report button. You will get the notification once the report is available for you to download.
Related Topics